Statistics
Detailed influencer statistics in MeerPartners: 7/30/90-day periods, tabs for clicks, conversions, commissions, breakdowns by offer and level, EPC and CR analysis.
The "Statistics" section (/i/stats) is in-depth analytics on top of the dashboard. Here you have switchable charts for clicks, conversions and commissions, and two breakdown tables: by offer and by network level. You come here to understand exactly what works and where to scale traffic.
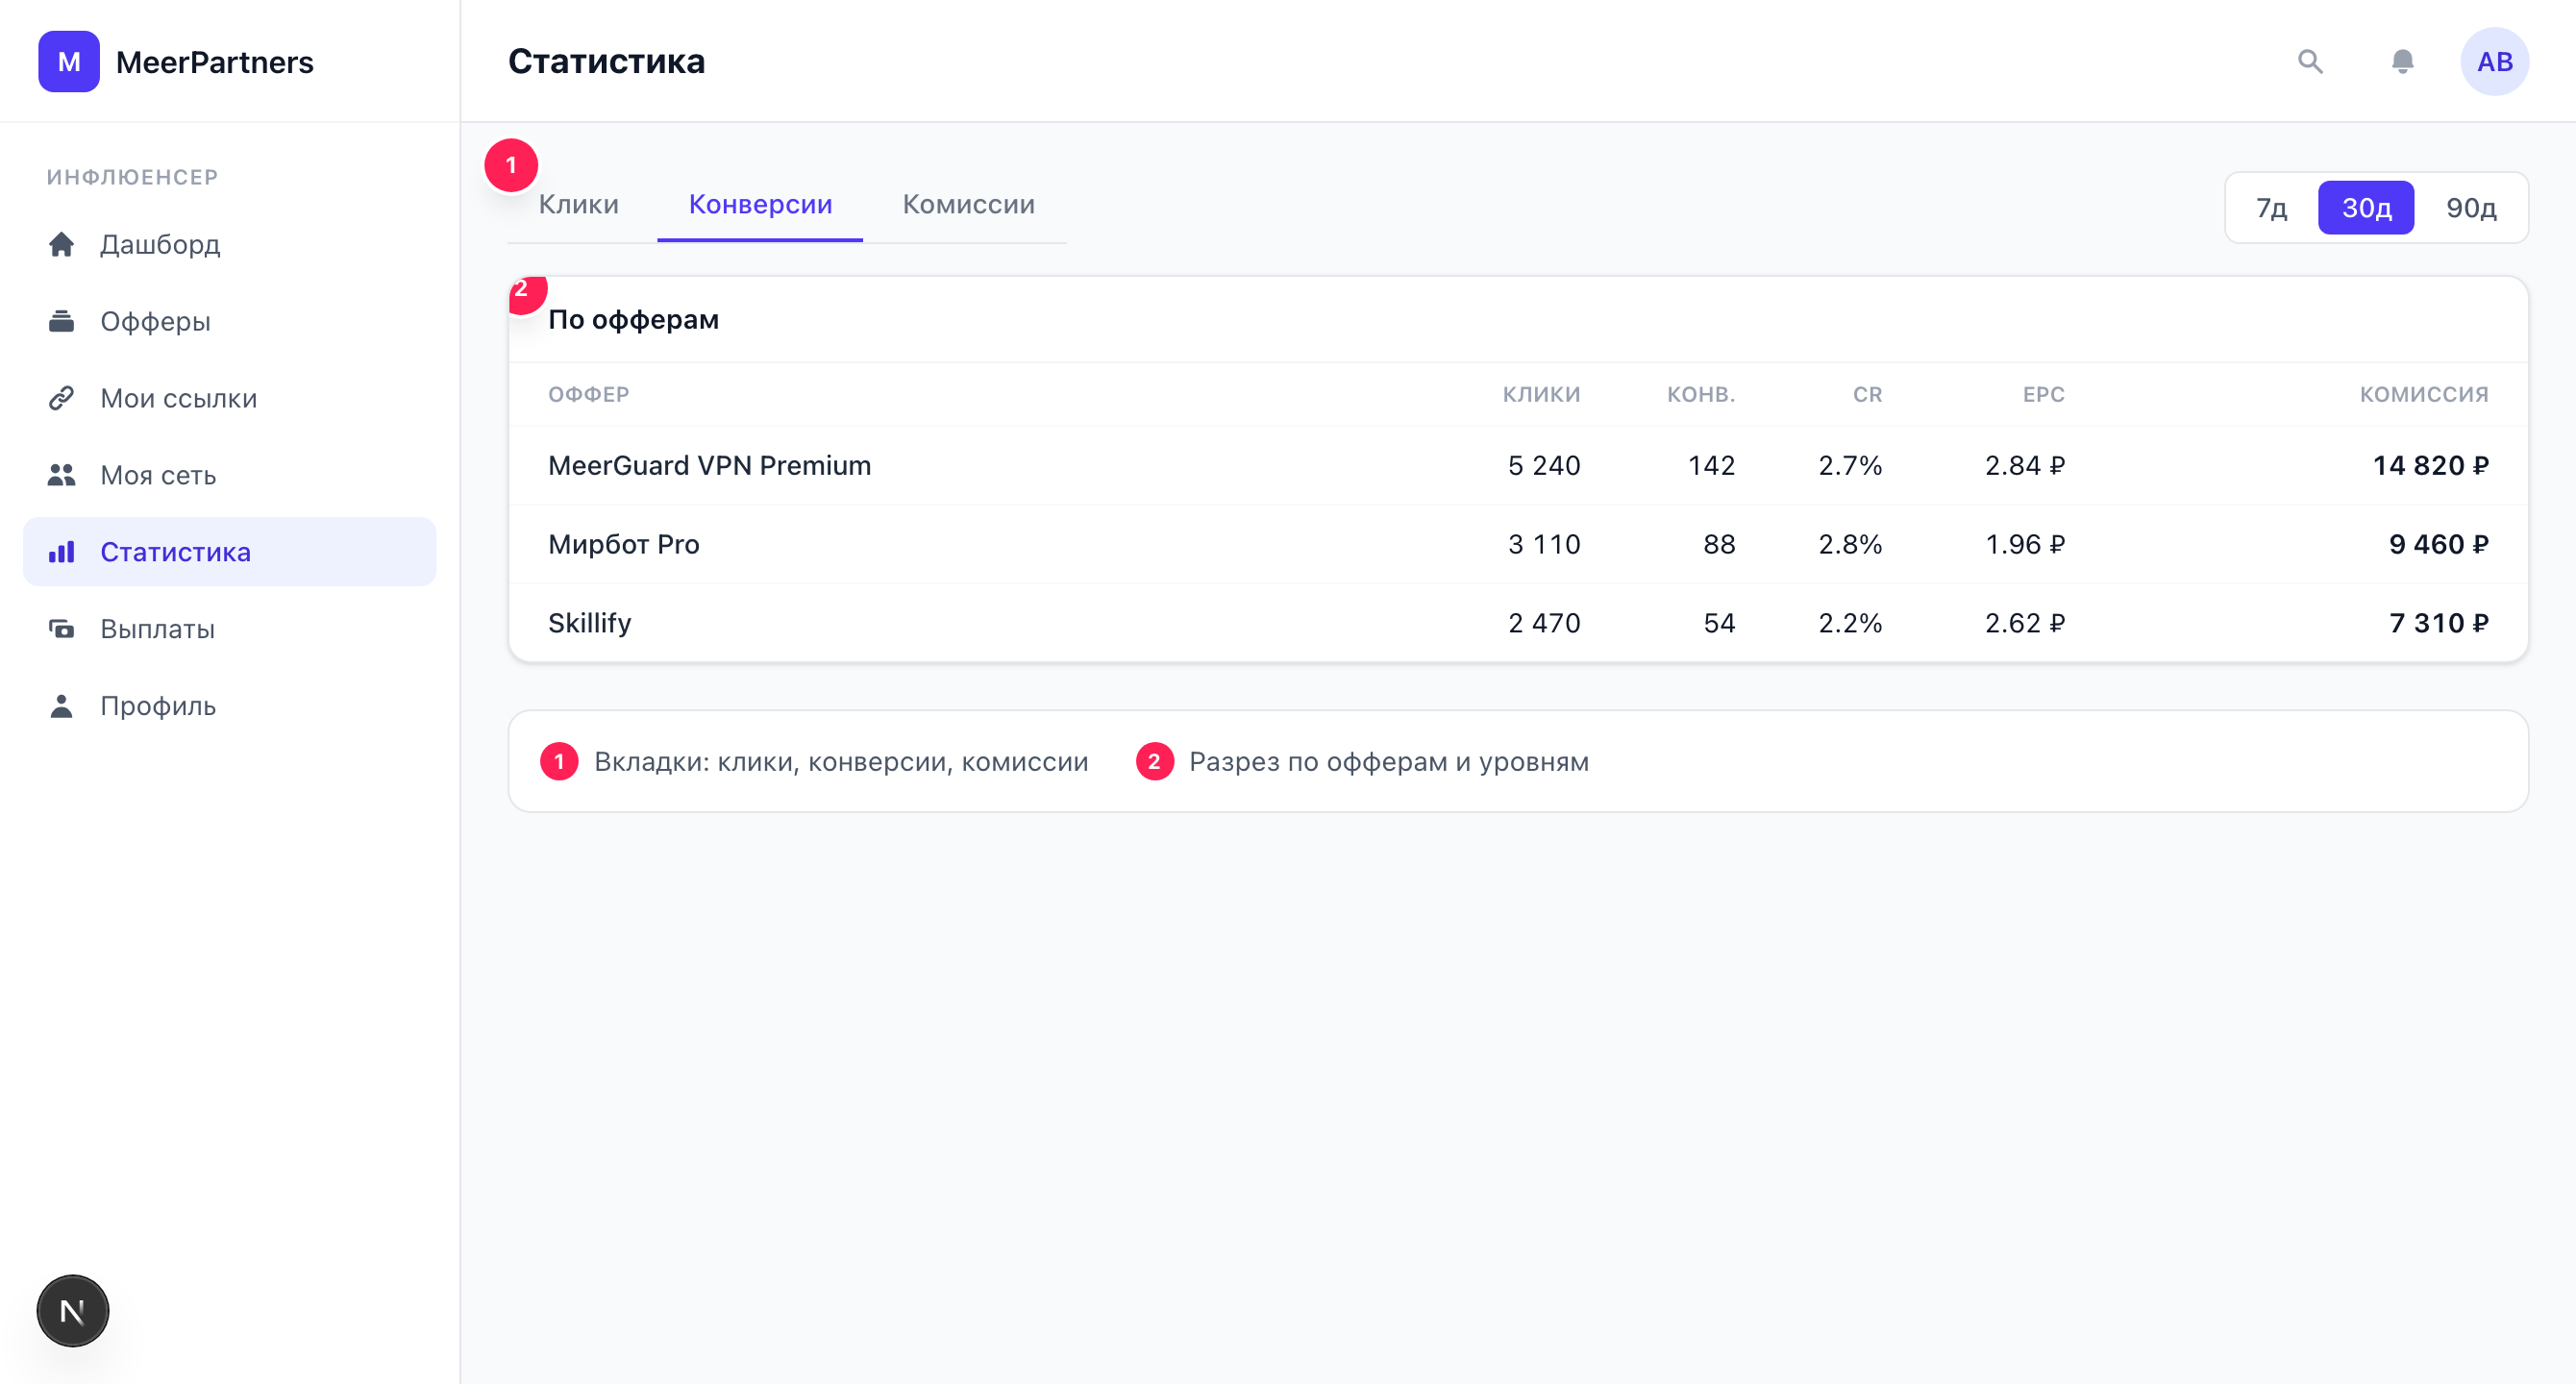
Selecting the period
In the top right is the switcher: 7 days, 30 days (default), 90 days. The period applies to all elements on the page at once.
Summary KPIs
Three cards above the charts are the totals for the period:
- Clicks — total clicks.
- Conversions — total credited target actions.
- Commissions — the amount of commission accrued.
Chart tabs
Below the KPIs are switchable tabs, one metric in each:
| Tab | What's on the chart |
|---|---|
| Clicks | The trend of clicks by day. |
| Conversions | The number of conversions by day. |
| Commissions | The commission amount by day. |
If there's no data for the period, "No data for the period" is displayed instead of the chart.
The "By offer" breakdown
The table shows each offer's contribution during the period: Offer, Clicks, Conv. (conversions) and Commission. This is the basis for deciding which offers to scale and which to turn off.
Calculate CR and EPC from the table rows
From this table it's easy to estimate two key indicators for each offer:
- CR (conversion rate) = Conversions ÷ Clicks × 100% — what percentage of clicks turn into a result.
- EPC = Commission ÷ Clicks — how much money a single click brings.
An offer with a high EPC pays off traffic better, even if its CR is modest. And an offer with a high CR but a low rate may lose out in money — compare EPC specifically.
The "By level (multi-level)" breakdown
If you have a referral network, a block with a per-level commission breakdown appears below: L0 (direct) — your personal traffic, then L1, L2, … — earnings from network partners, with the number of conversions and the amount for each level. More on how levels are structured — My network and Multi-level program.
How to analyze performance
Start with the breakdown by offer
Find the offers with the best EPC — these are your traffic priorities.
Compare CR between offers
A low CR with good traffic is a signal that the offer converts your audience poorly or has strict crediting terms.
Check sources via sub_id
Tag traffic with sub_id to see which channel and creative deliver results.
Assess the network's contribution
In the breakdown by level, see how much partners add — perhaps it's worth more actively inviting to your network.
The data may differ from the dashboard in form
The dashboard shows top offers and recent conversions, while "Statistics" shows full breakdowns and charts for each metric. The figures for the same period match; only the depth of detail differs.