Dashboard and metrics
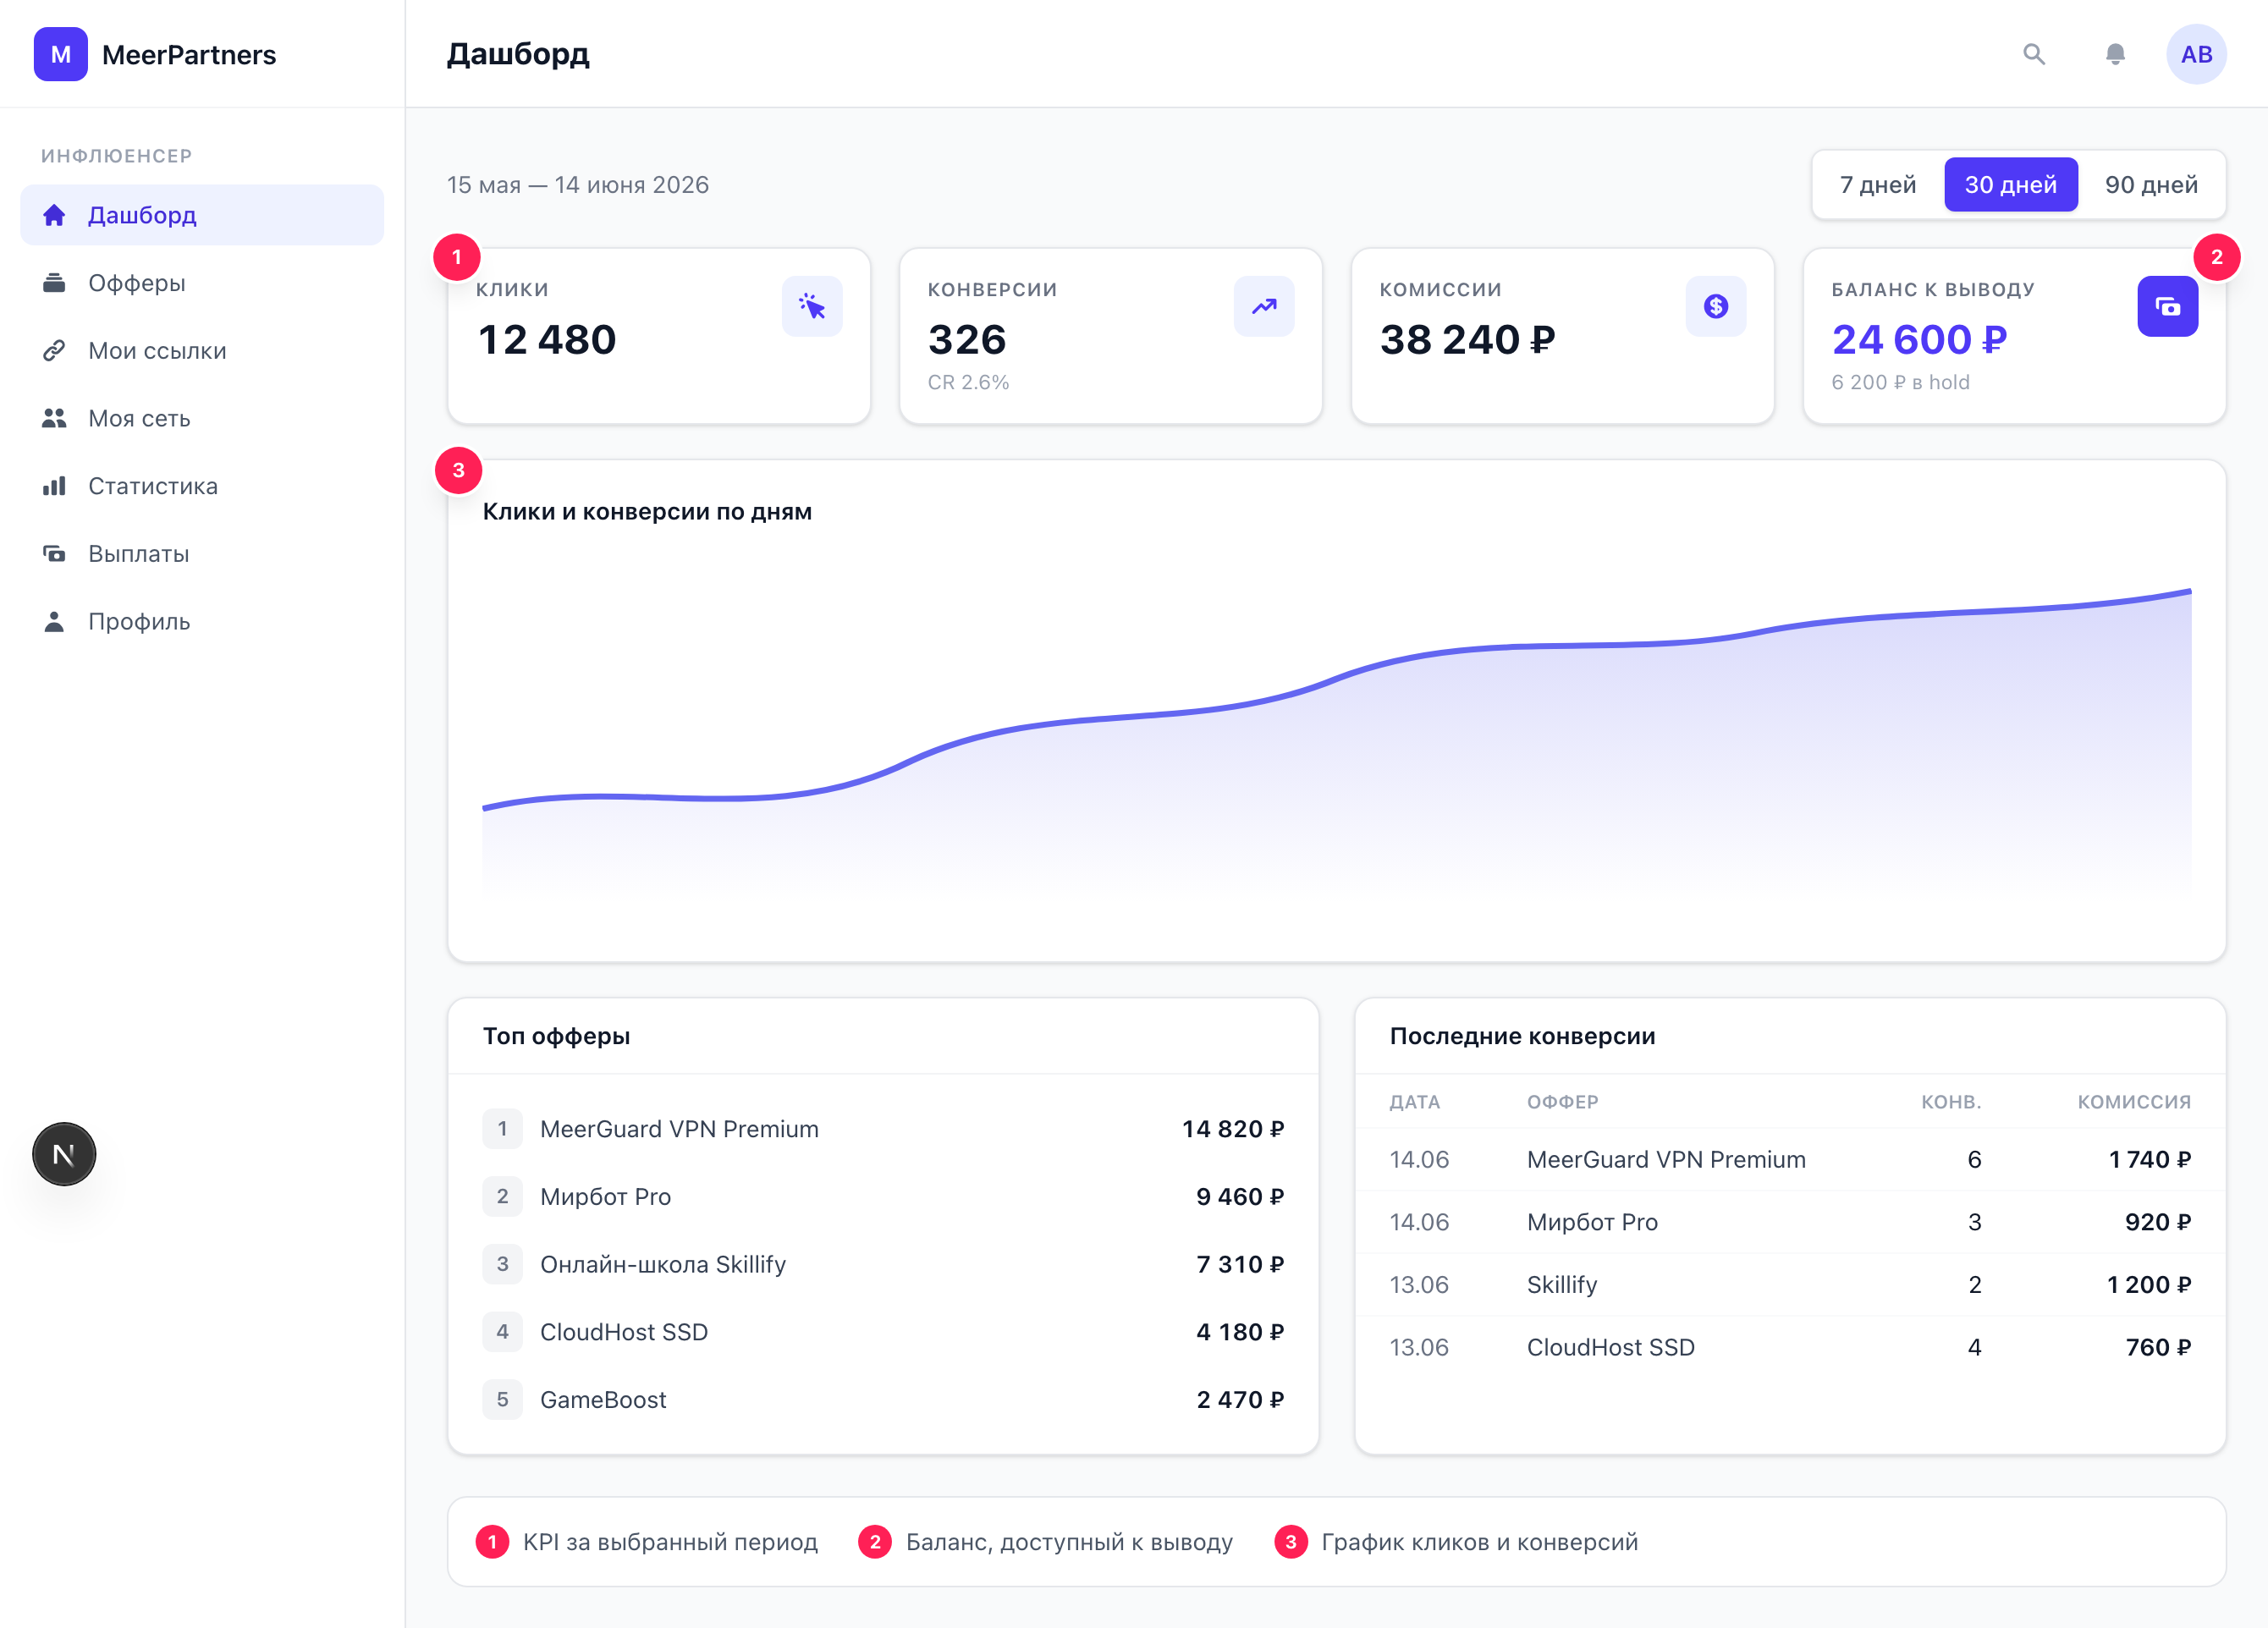
The main screen of the MeerPartners influencer dashboard: KPI clicks, conversions, commissions and balance available for withdrawal, daily chart, top offers and recent conversions.
The dashboard (/i) is the starting screen of the workspace. It answers the main question: "how are things going right now". At the top are four key metrics (KPI), below them a trend chart, top offers by commission and recent conversions. Everything is calculated for the selected period.
Selecting the period
In the top right corner is the period switcher: 7 days, 30 days, 90 days. The 30-day period is open by default. The period affects everything at once: KPIs, the chart, top offers and the list of recent conversions are recalculated for the selected range. The specific dates of the range are shown under the heading (for example, "May 15 — Jun 14").
KPI — four cards
| Metric | What it shows |
|---|---|
| Clicks | How many clicks on your tracking links during the period. |
| Conversions | How many target actions (leads/sales) were credited during the period. |
| Commissions | The amount of commission accrued during the period (across all your offers). |
| Balance available for withdrawal | The current amount available for withdrawal right now (not for the period, but as of the moment of viewing). |
How 'Commissions' differs from 'Balance available for withdrawal'
Commissions are accruals for the selected period, including those still "maturing" in hold. Balance available for withdrawal is what has already passed hold and is available for payout today. That's why the amounts are almost always different — this is normal. More on the freeze — Hold and approval.
The balance available for withdrawal is shown in your payout currency (set in your profile). If you have accruals in several currencies, the dashboard shows the balance in your primary currency; for a full breakdown by currency see the Payouts section.
The "Clicks and conversions by day" chart
Below the KPIs is a trend chart for the period: two areas, clicks and conversions, by day. It reveals traffic spikes and dips. If there's no data for the period, "No data for the period" is shown instead of the chart.
How to read the chart
If clicks grow but conversions stay flat — the problem is most likely in traffic quality or the offer's landing page, not its rate. If clicks are dropping too — it's worth checking whether the link is active and whether the offer has been paused (see Tracking links).
Top offers by commission
The block at the bottom left shows up to five offers that brought in the most commission during the period, sorted by amount. These are your "workhorses": it's worth scaling traffic on them. The "All offers →" link leads to the catalog.
Recent conversions
The block at the bottom right is a table of recent conversions with the columns Date, Offer, Conv. (number of conversions) and Commission. It helps you quickly confirm that actions are being credited and commission is being accrued.
Conversions don't appear instantly
A conversion is created when the business's server sends a postback after the user's target action. Some time may pass between the action and the row appearing in the table — this depends on the specific business's integration, not on the platform.
If there's no data
- Just started — an empty dashboard is normal: get your first link in the offer catalog and bring in traffic.
- There's traffic but no conversions — check the breakdown by offer in Statistics: you may be driving traffic to an offer with strict terms or from a geo that isn't credited.
- Statistics loading error — refresh the page; if it recurs, try later or write to support.
What's next
Deeper than the dashboard: tabs for clicks/conversions/commissions and breakdowns by offer and level.
Metrics for each individual link: clicks, conversions, EPC.
Figure out what in your balance is available for withdrawal and what's still on hold.